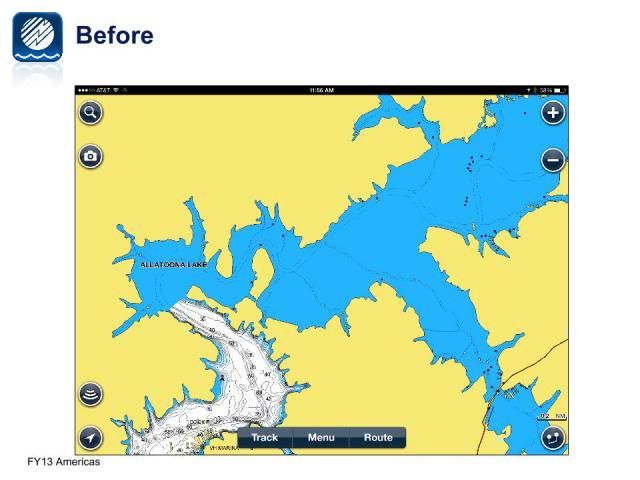
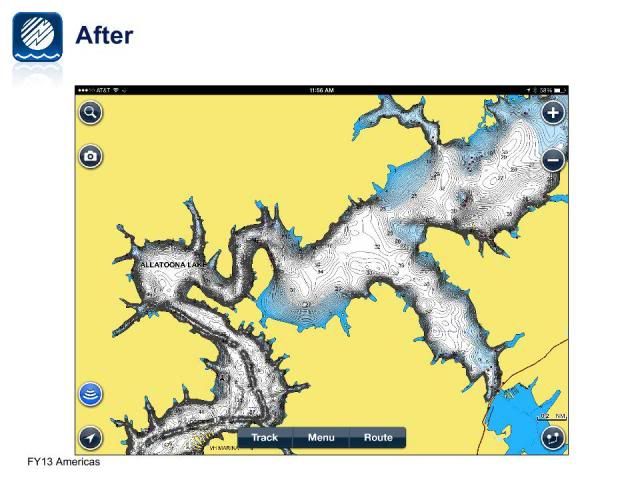
Hey guys. I have posted a few screen grabs of Quinte on the Navionics app showing the "sonar charts" layer turned on when the "Navionics +" in app purchase has been made.
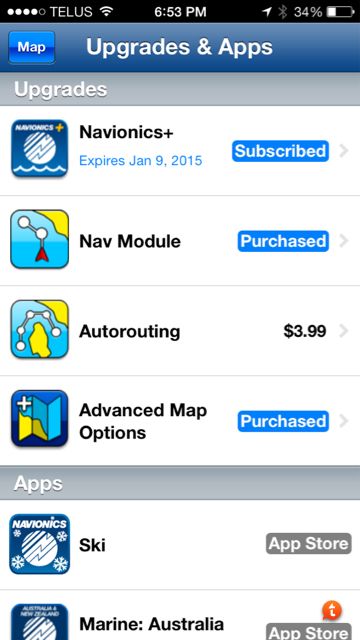
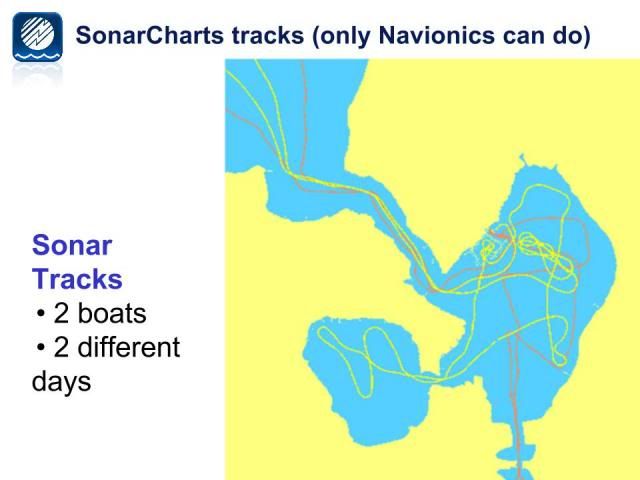
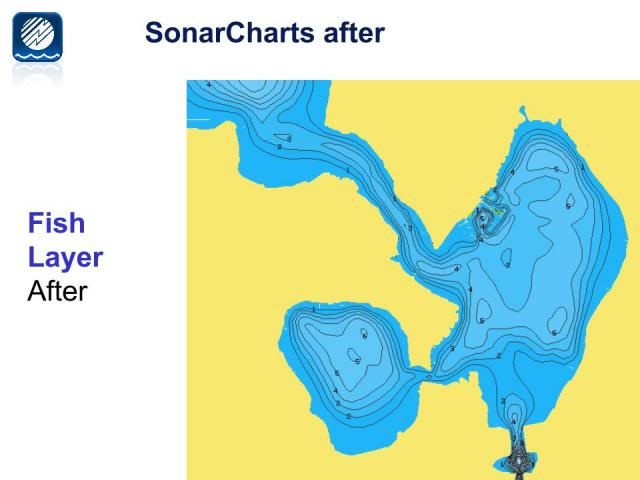
In a different thread someone asked how accurate the information is. The "Sonar Charts" layer is from recordings gathered from Prostaff and other sources. As of this year it can also now be generated by anyone who uploads sonar logs to Navionics.com. If you have a humminbird or Raymarine you can record your sonar logs, upload to Navionics and within 24-72 hours Navionics generates map data with it. If you have the app you automatically get this data when you turn on the "sonar charts" layer by hitting the little icon in the bottom left corner (assuming you have purchased the Navionics + in app upgrade). You can also get this data using "freshest data" on your navionics chip by going to Navionics.com and updating your chip (assuming its update able). So as time progresses this information will be the most progressive and accurate charts out there.
Here are a few examples of what it will look like.
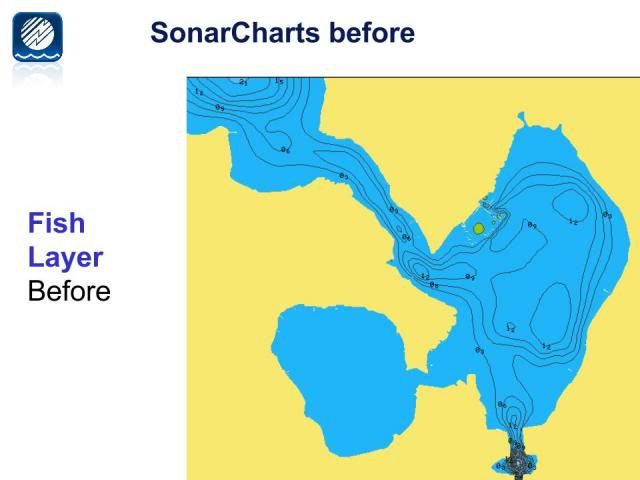
Hay bay looks like this on the Navionics app without the "Navionics +" upgrade
Scott


